|
|
This page is not yet completed and still under construction. |
1. Introduction into usage of Panorama
Detailled preconditions for operation and usage of Panorama are described here: https://rammpeter.github.io/panorama.html
1.1. Conditions for DB-user for usage with Panorama
-
Basically, the system privilege SELECT ANY DICTIONARY is required for the DB user used to log in to Panorama
-
To use Oracle’s own ready-made AWR and ASH reports as well as the SQL Monitoring plug-in, as of DB Release 11.4, the system privilege OEM_MONITOR is also required
1.2. Control / usage of Panorama-GUI
1.2.1. Globally
-
System-wide contextual information by MouseOver hints are often offered
-
Details of displayed values can be triggered by clicking on hyperlinks
-
The detailing / subsequent steps in the workflow will usualy be continued from top to bottom under the previous browser content
-
The triggering of links in earlier steps of the workflow (earlier in the history of the triggered actions) deletes the underlying block in the browser and replaces it with the result of the current action
1.2.2. Tables
-
The table display is sorted by clicking on the column header
-
Sort by multiple columns can be done by successive sorting of individual columns
-
Other functions can be accessed via the context menu (right mouse button):
-
Column-neutral functions
-
Show a search-filter row in the table with the possibility of filtering the table by the values of each displayed column
-
Export of the table contents to Excel via CSV file
-
Change the line height between one-line and full view of the field contents
-
-
Column-related functions
-
Display of the column sum, number of different values
-
Display of the field content in popup window (facilitates copy & paste of a field content)
-
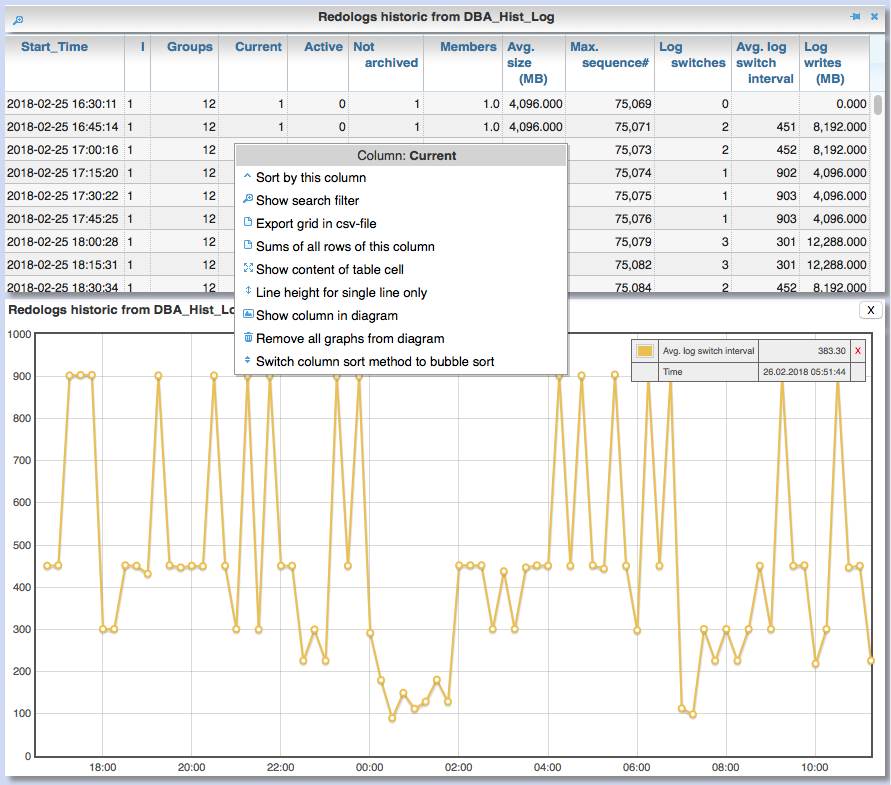
Showing and hiding the graphical representation of the column values in diagram (only if table rows have a time reference)
-
-
-
Table header can contains icons:
-
Show search filter (left side)
-
pin this table (prevent it from overwriting by parent reload, right side)
-
2. Essential analysis ways
Basically there are two ways for analysis of the operating status of the DB system:
-
Evaluation of the current state based on interal system views (V$, dictionary views etc.)
-
Retrospective analysis of the operating status for a given period in the past based on recorded data
Retrospective analysis with Panorama is regularly based on Oracle’s Active Workload Repository (AWR).
Precondition for usage of AWR is the Enterprise Edition of the DB combined with licensing of the Diagnostics Pack.
An also supported alternative to AWR is the Panorama-Sampler, which allows retrospective analysis also for Standard Edition rsp. without Diagnostics Pack.
There are three main pillars of analysis supported by Panorama:
-
DB sessions
-
SQL statements
-
DB objects
2.1. DB session analysis
2.1.1. Evaluation of current connected DB sessions via session list
Menu option "DBA general" / "Sessions" Lists sessions sorted by the sum of logical and physical block accesses of the session, limited to active sessions by default. Filter allows to limit hits by user. Machine, process ID, modules etc. .
Click in column "SID/SN" shows details of a session incl. current SQL and previous SQL Function buttons allow further detailed views of the session, e.g. history of this session in ASH (Active Session History).
2.1.2. Evaluation of the wait state of the currently active sessions
Menu option "Analyses/statistics"/ "Session waits" / "Current" gives an overview over the session wait states of currently active sessions as well as the current concurrency state between sessions.
2.1.3. Retrospective analysis of active DB sessions via Active Session History (ASH)
The Active Session History (ASH) stores context information about active DB sessions. This info is recorded every second in the SGA memory (visible by the view sys.gv$Active_Session_History) and kept at least until the next AWR snapshot or corresponding available SGA memory. During the AWR snapshots (default=hourly) the volatile data from sys.gv$Active_Session_History is copied to the persistent structure sys.DBA_Hist_Active_Sess_History, but here only in 10-second intervals. The data in sys.DBA_Hist_Active_Sess_History is kept for the retention period of the AWR data (default=7 days, recommended > 30 days). For the evaluation Panorama combines both data sources, as long as available the secondly samples are used, otherwise the 10-secondly samples. The ASH analysis in Panorama can be accessed via the menu item "Analyses/statistics" / "Session waits" / "Historic" as well as with predefined filters from various detailed views (Session, SQL etc.). For start of investigation, the time period as well as the initial grouping criterion must be selected.
In the display of waiting times and information grouped by the selected criterion, there are the following options for further detailing;
-
Display of the time course as a diagram via context menu: Top 10 of the grouping criterion as separate curves, rest in one curve, condensation selectable after 60 seconds, 10 seconds or 1 second.
-
Drilldown into data of the selected row by splitting according to various criteria, for this click into corresponding column
-
Switch the perspective from session wait time to involved SQLs, acessed data structure, executed PL/SQL-objects etc.
-
Listing of the individual sampled records according to the current filters (smallest grain of information) by clicking in the "Samples" column
2.1.4. Analysis of concurrency issues (e.g., blocking locks)
2.1.4.1. Analysis of current locks
Menu item "DBA General" / "DB-Locks" / "Current" allows to display various lock states:
-
all currently existing DML locks (DML = data manipulation language)
-
all blocking DML locks
-
all blocking DDL locks (DDL = data definition language)
-
not completed 2phase-commits (e.g. via DB-Link)
2.1.4.1.1. Analysis of current blocking DML locks
There are two analysis paths for viewing existing DML locks, certain special blockage situations are only displayed by one of the two variants:
Analysis of current blocking DML locks via gv$Lock:
Menu option "DBA General" / "DB Locks" / "Current", button "Blocking DML Locks" shows the hierarchical blocker/waiter relationships between DB sessions, starting with the session triggering the lock cascade. Data base is the information from gv$Lock about waiting lock requests.
Analysis of current blocking DML locks via gv$Session
At menu item "Analyses/Statistics" / "Session waits" / "Current", in addition to the wait events of the currently active sessions, blocker/waiter relationships based on gv$Session are listed hierarchically here.
2.1.4.2. Retrospective analysis of concurrency problems
2.1.4.2.1. Retrospective analysis of concurrency problems via Active Session History (ASH)
Menu item "DBA General" / "DB Locks" / "Blocking Locks historic from ASH" lists triggering sessions of the cascade of blocking locks in the selected period sorted by the summed waiting time of all DB sessions attached to it. The data basis for the evaluation is the blocking session information of the Active Session History.
2.1.4.2.2. Retrospective analysis of concurrency problems by recordings of Panorama-Sampler
Menu item "DBA General" / "DB Locks" / "Blocking Locks historic from Panorama Sampler" lists triggering sessions of the cascade of blocking locks in the selected period sorted by the summed waiting time of all DB sessions attached to it. The data basis for the evaluation is the information about past blocking lock situations collected by Panorama Sampler. The menu item is only available if the recording of blocking lock situations by the panorama sampler is activated for the DB.
2.2. SQL analysis
2.2.1. Determination of possibly problematic SQL statements which are still hold in memory
Menu option "SGA/PGA-Details" / "SQL-Area" offers two entries with selection of filters and sorting criterion: at the "SQL-ID" level (each unique SQL has a result row) on the level "SQL-ID, Child-Number" (each separately parsed child cursor of an SQL has a result row).
Clicking on SQL-ID in the table shows a detailed view of the SQL statement.
When entering via the "SQL-ID" level, the execution plan is only shown if it is unique for the SQL-ID (only one execution plan exists). If several child cursors exist for the SQL ID, they are added as a table with the option to switch to the detail view of the concrete child cursor (which then also contains the execution plan).
2.2.2. Retrospective analysis of executed SQLs via Active Workload Repository (AWR)
Access via menu item "SGA/PGA details" / "SQL-Area" / "Historic SQLs" with specification of time period, sorting and possibly filter or via cross reference e.g. from evaluation of Active Session History.
A click on the SQL-ID in the result list shows the detail view of the SQL with the values between the AWR snapshots that cover the specified time period.
The buttons in the footer bar provide further details about this SQL.
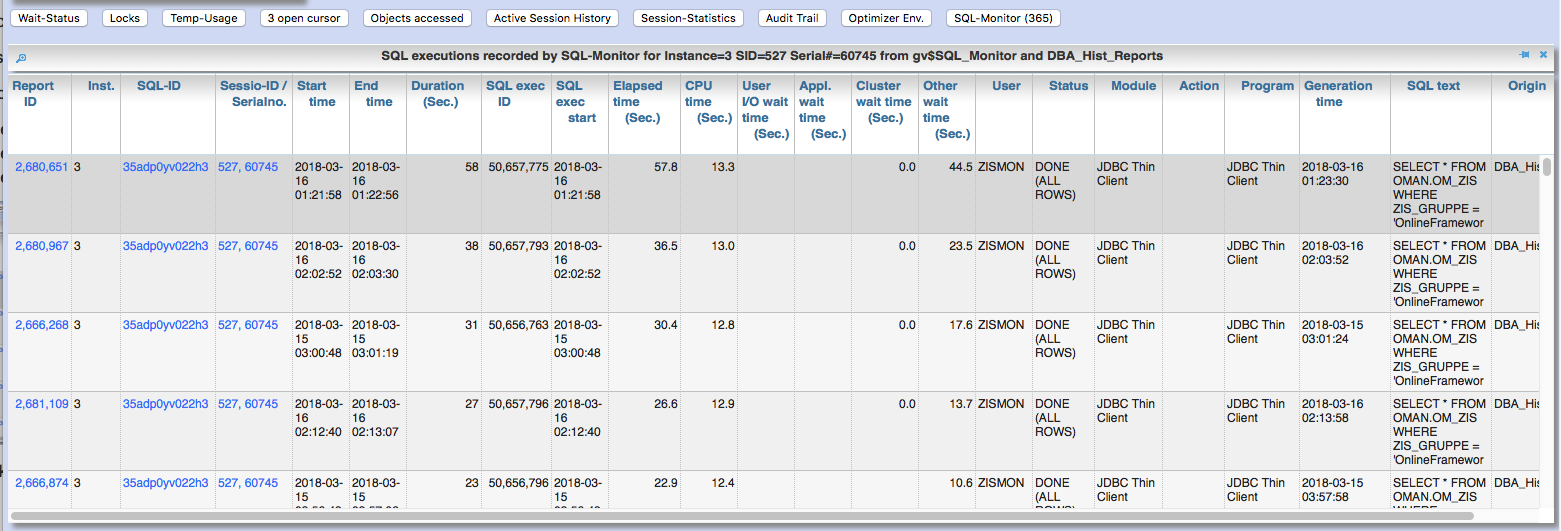
2.2.3. Evaluation of recorded SQL monitoring reports
SQL-Monitoring records individual executions of an SQL statement in detail if they fulfill one of the following prerequisites:
-
Execution with parallel query
-
CPU- or I/O-activity for more than 5 seconds
-
Optimizer-hint
MONITORin SQL statement -
ALTER SESSION|SESSION SET EVENTS 'sql_monitor [sql: 5hc07qvt8v737] force=true';
Starting with Oracle 12.1, the short-living detailed monitoring reports from gv$SQL_Monitor are also available within the AWR retention period via DBA_Hist_Reports and DBA_Hist_Reports_Details.
The precondition for using the monitoring reports is licensing of the tuning pack for the Enterprise Edition.
The SQL monitor reports existing for the respective object (SQL / DB session) and period can be called in Panorama via the button "SQL Monitor" from:
-
SQL detail view from SGA
-
historic SQL detail view
-
current session detail view
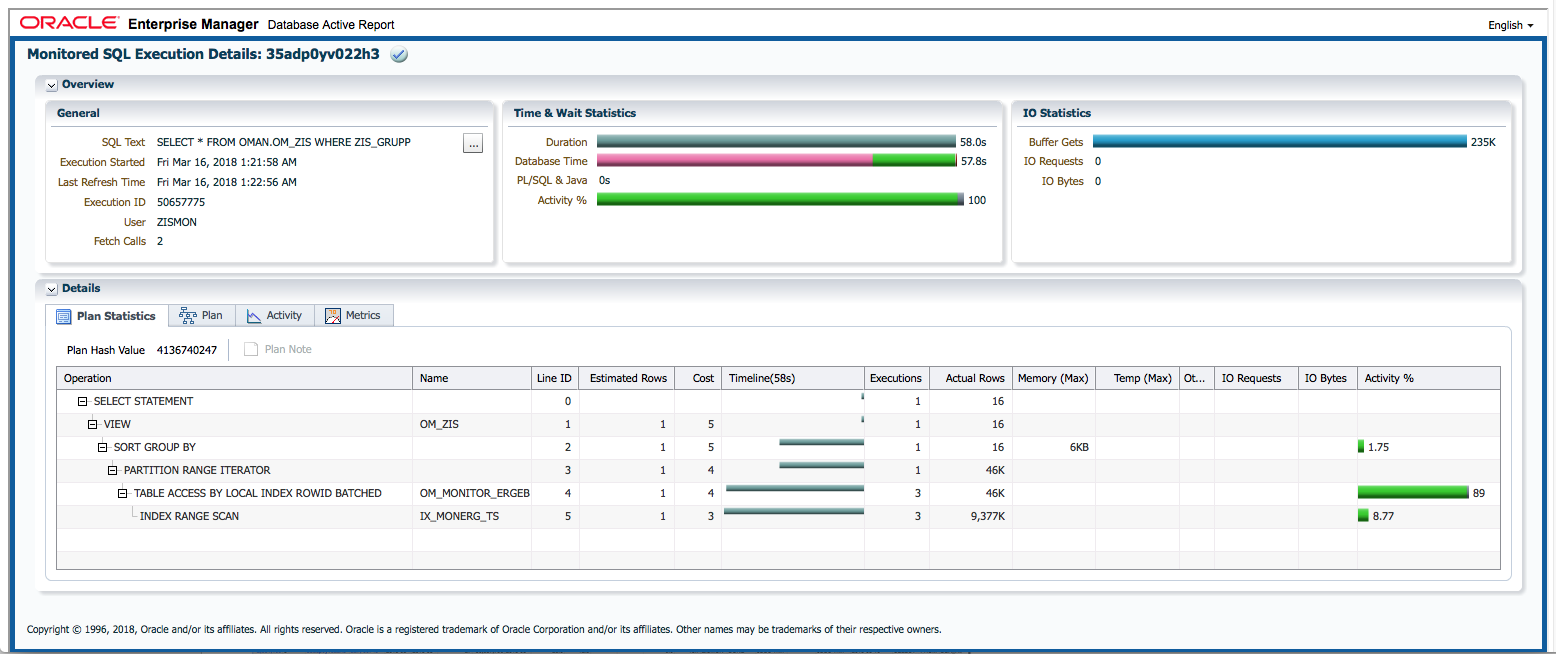
Clicking on the report ID opens the Database Activity Report known from the Enterprise Manager for this SQL execution in a new browser tab. If an internet connection is possible for the browser, it will be displayed as an active page enriched with CSS and Javascript from https://download.oracle.com/…; , otherwise as a static HTML page.
If the DB Activity Report ist not shown, please check browser console if there are security restriction settings active.
In addition to Panorama’s core functions, the SQL Monitor Report offers: - Display of the execution plan with the activities of the individual steps on time line - Show real execution counts and result counts per step of execution plan - Show real execution times and I/O operations per step of execution plan - Show recursive SQLs executed by the SQL statement and their percentage of total execution time
2.3. DB Objects
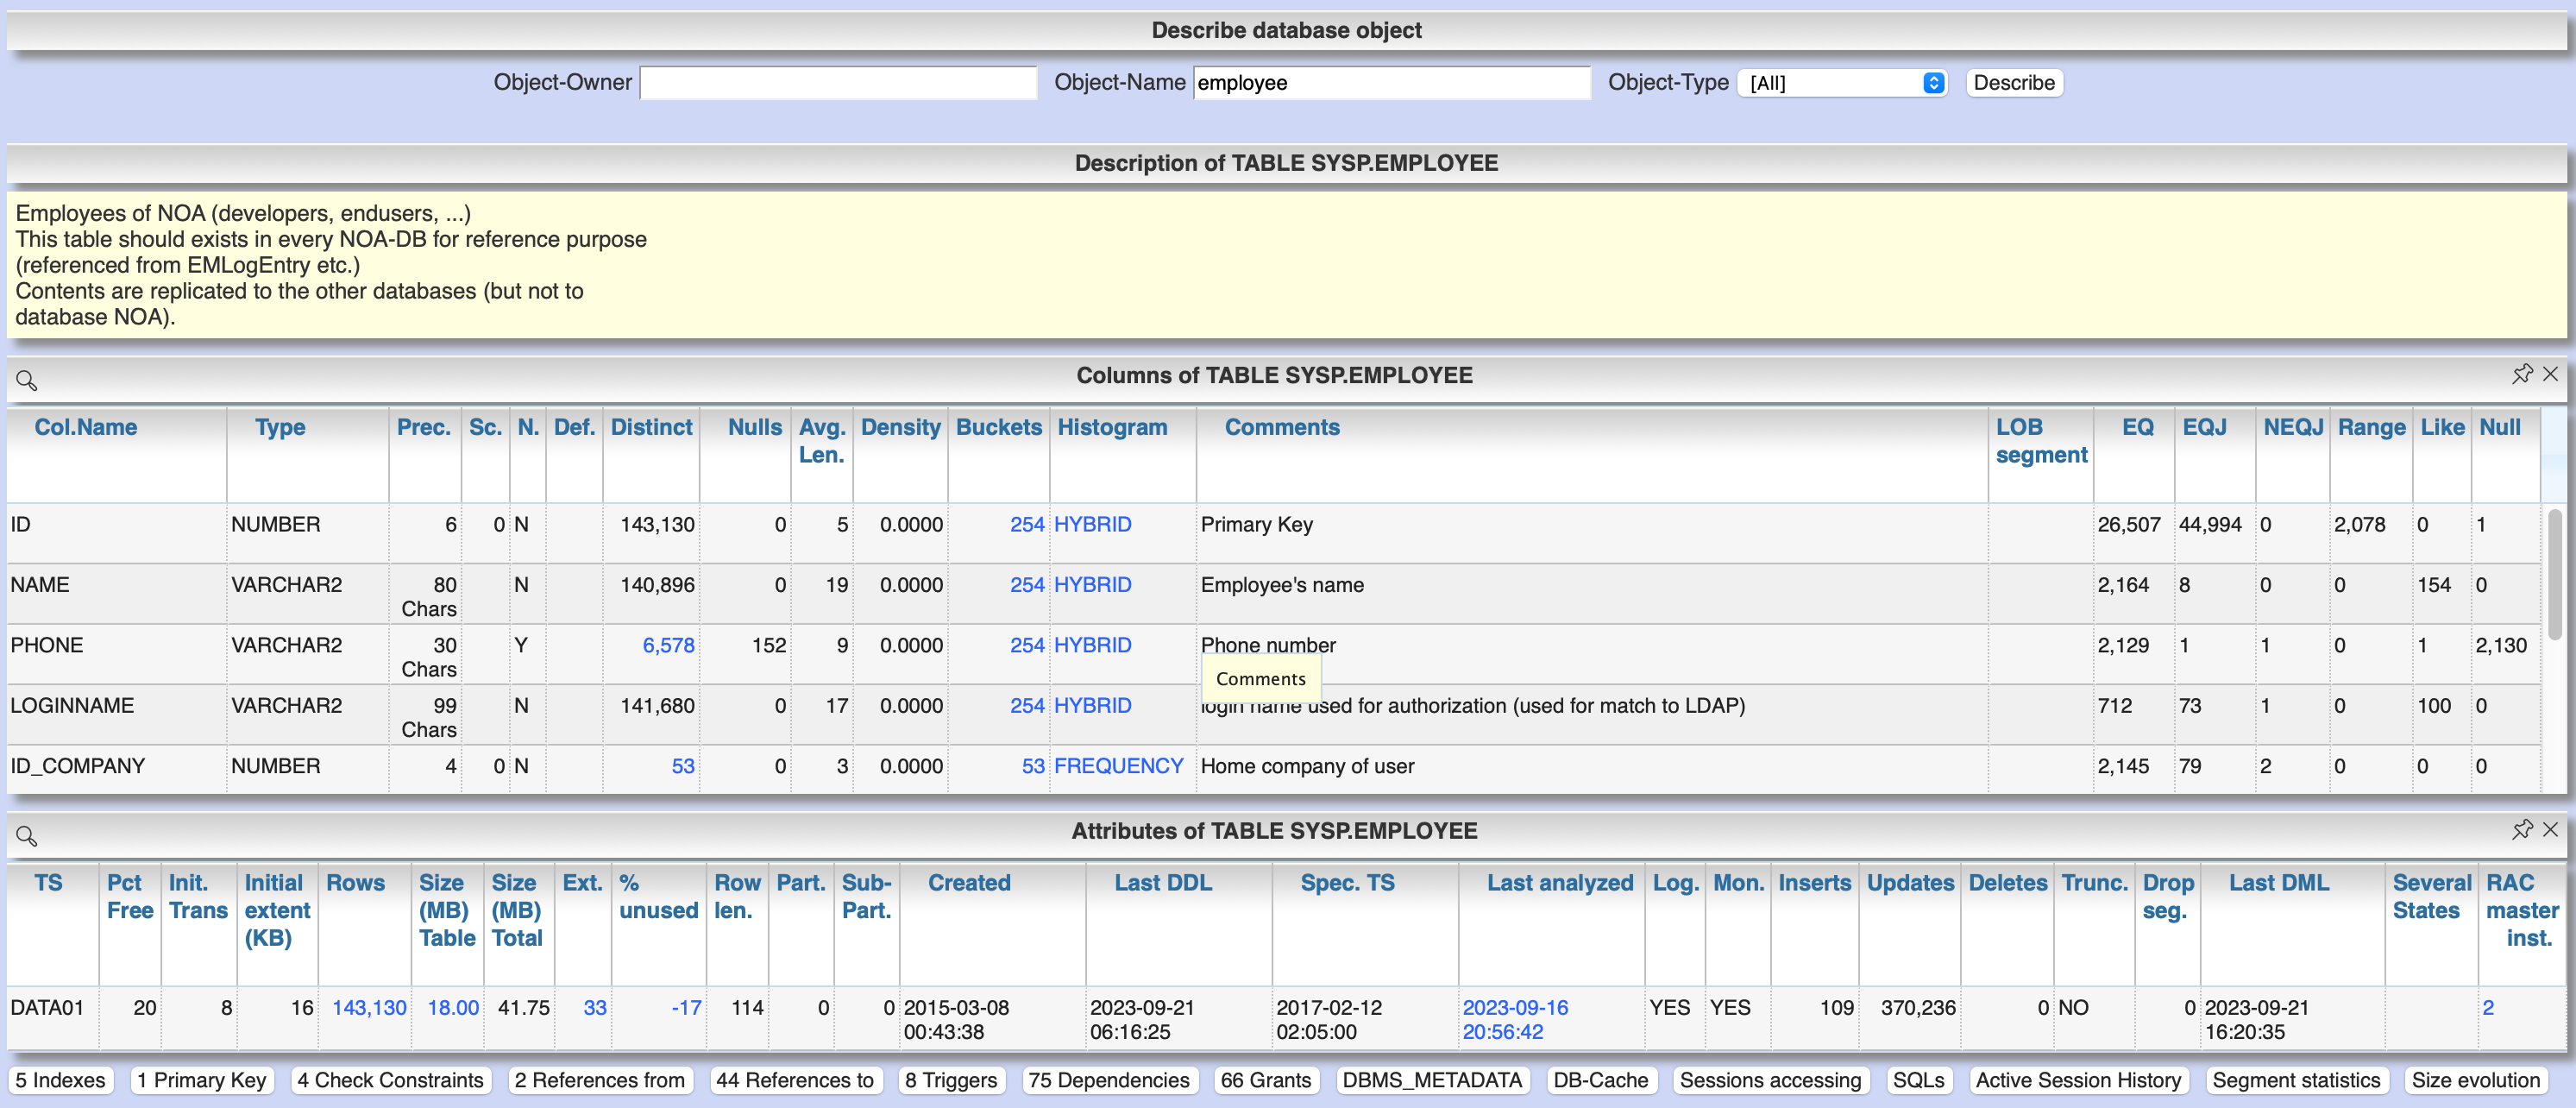
2.3.1. Detail information about DB objects (tables, indexes etc.)
Menu item "Schema/Storage" / "Describe Object" allows to display the structure and current state of a particular DB object. The buttons at the footer line let you dig deeper into several details of that object. This view is also linked from several other views.
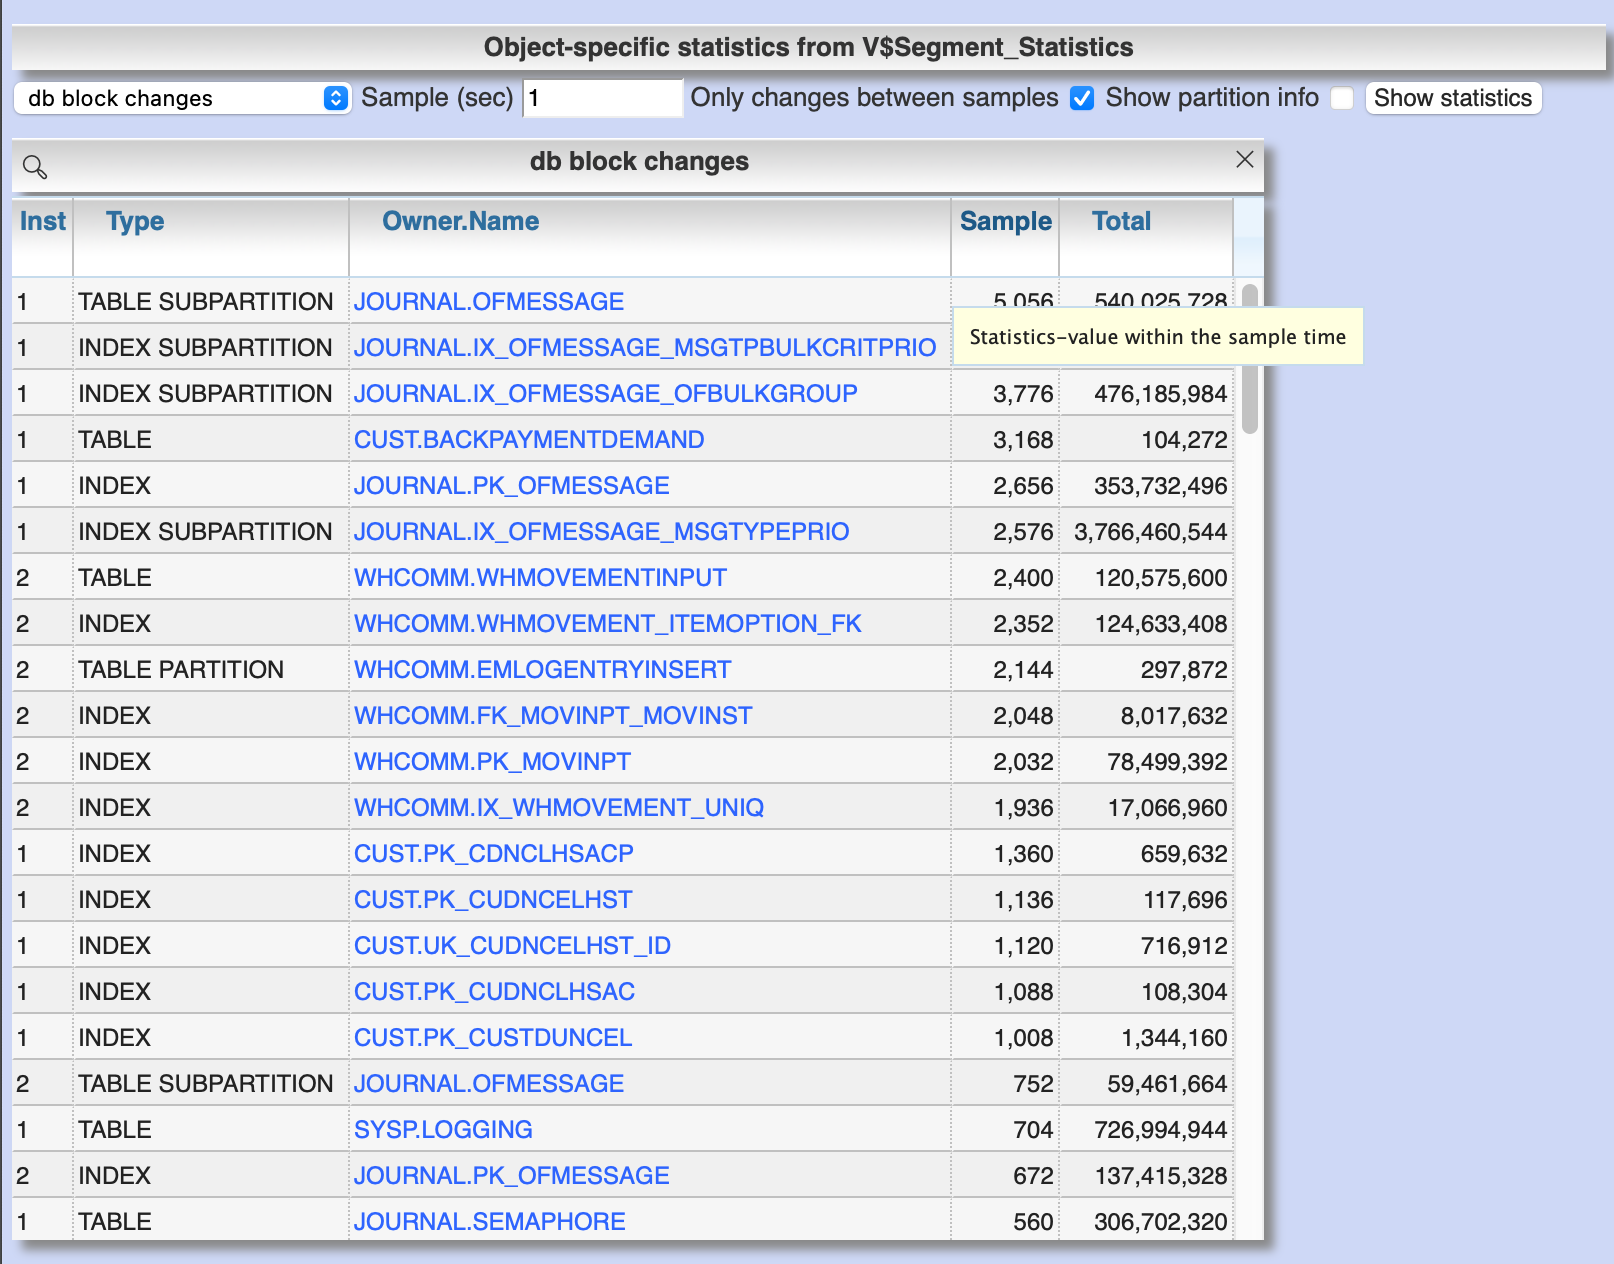
2.3.2. Current statistics for DB objects
Menu item "Analyses/Statistics" / "Segment statistics" / "Current" shows the change of statistic values of DB objects for the last x seconds.
2.3.3. Retrospective statistics for DB objects
Menu "Analyses/Statistics" / "Segment statistics" / "Historic" shows the change of statistic values of DB objects for the selected period. The first view gives the summary of serveral statistic values for the selected period based on AWR snapshots.
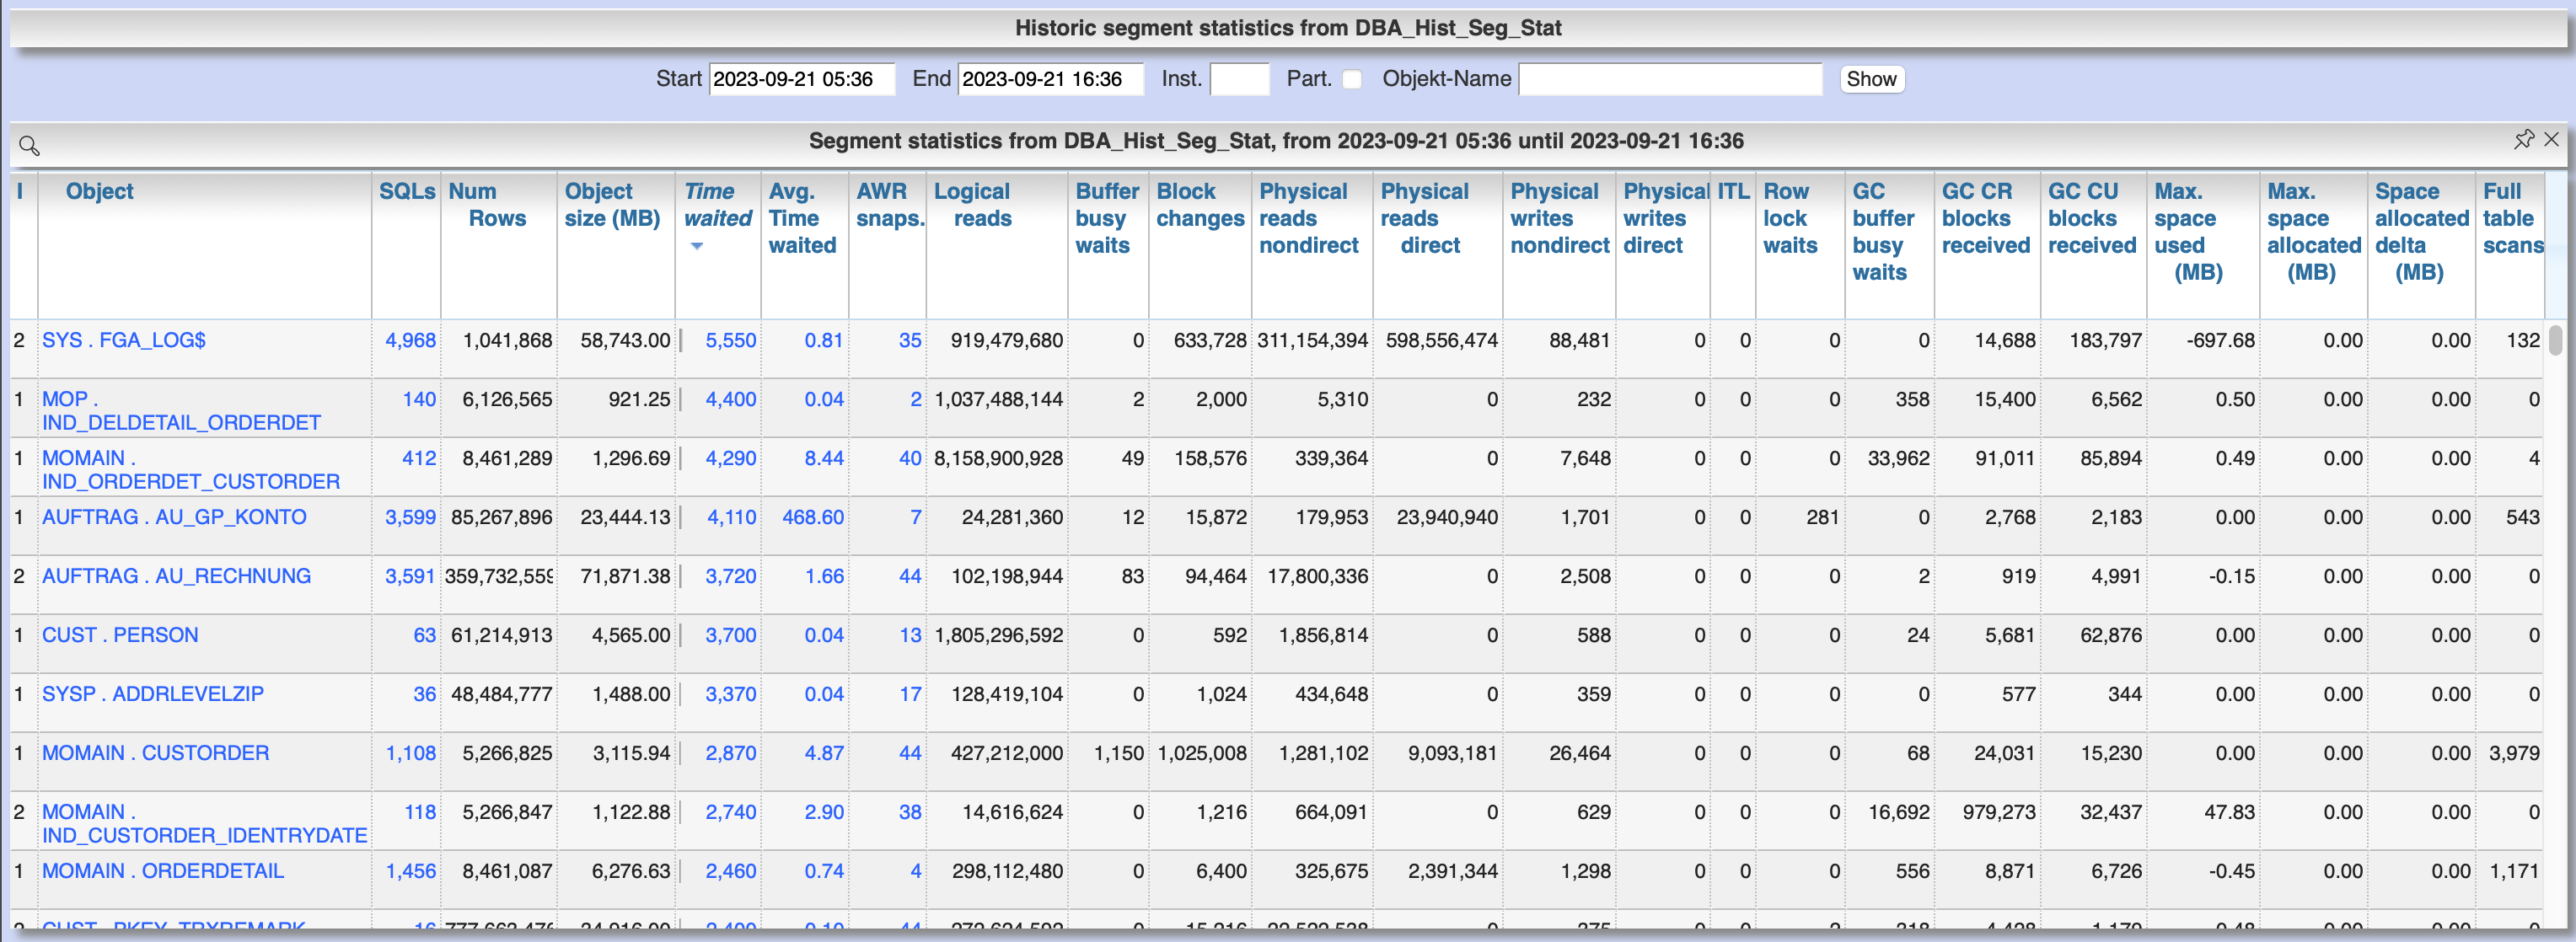
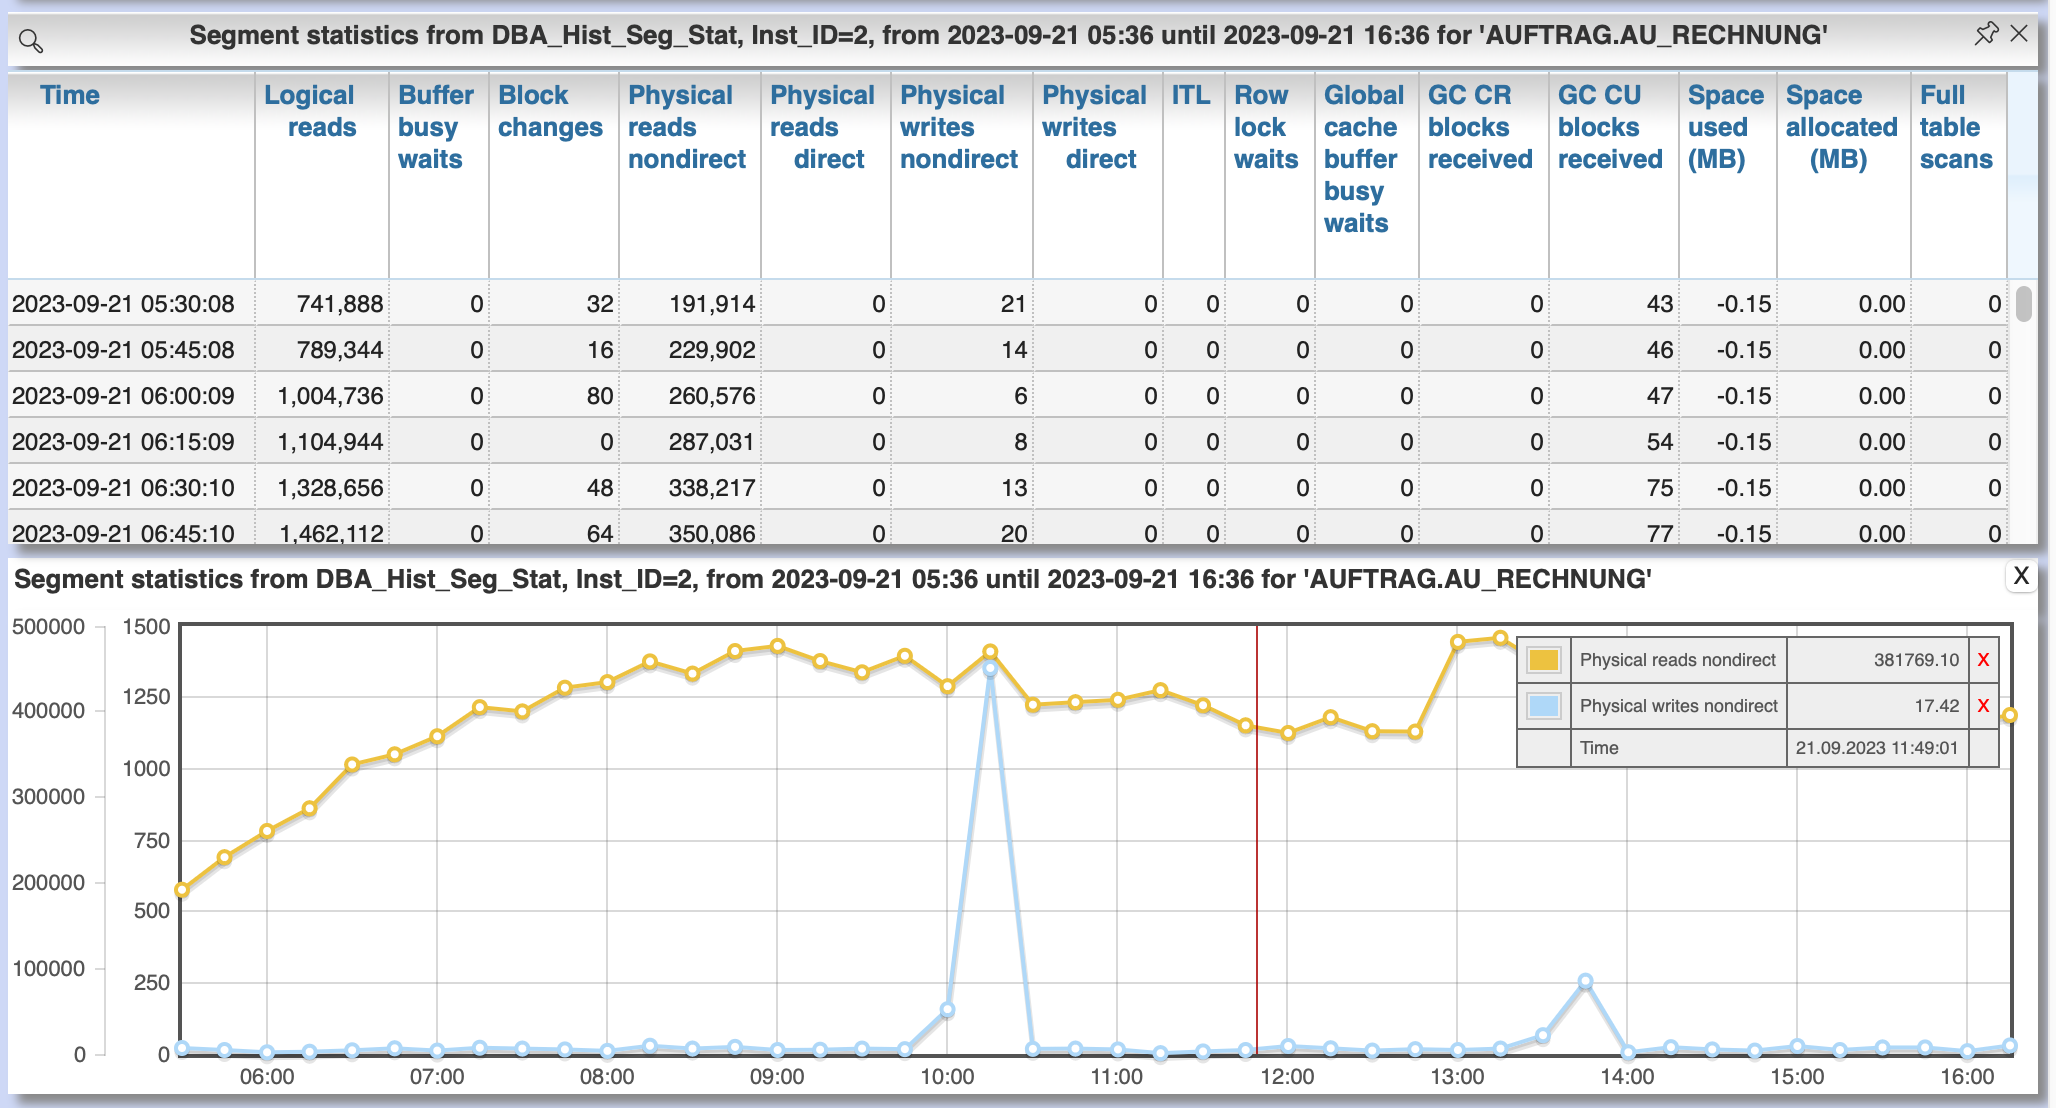
An click at the column "AWR snaps." lists the single AWR snapshots of the selected period for a certain object with the statistic values at that time. This values can then also be shown and compared in a diagram.
2.3.4. DB cache usage by objects
2.3.4.1. Use of the current DB cache by objects
Menu item "SGA/PGA details" / "DB cache" / "DB cache usage current" allows to display the concrete objects in the DB cache with their allocated memory sizes. It can be further detailed to the SQL statements of the objects currently kept in SGA as well as the structure information.
2.3.4.2. Retrospective analysis of DB cache utilization by objects via recording by Panorama-Sampler
At menu item "SGA/PGA details" / "DB cache" / "DB cache usage historic" past snapshots of the DB cache can be analyzed. The menu item is only available if the recording of the DB cache usage by panorama sampler is activated for the DB. Weighted average values of DB usage are shown for the period under consideration, if the analysis includes multiple snapshots.
Via links in the columns it is possible to display:
-
the structure information of the object
-
SQL statements executed in the considered period with access to the object in the execution plan history of concrete snapshots of the DB cache for an object including graphical representation in the diagram.
By clicking on the time of a concrete snapshot, all cache objects of this concrete snapshot are listed.
3. Evaluate / scan the DB system for potential performance antipatterns
Menu item "Special extensions" / "Dragnet investigation" allows scanning the DB system for over 100 different performance antipatterns
4. Evaluation of configuration and operation of the DB system
4.1. View the current DB configuration via initialization parameters
Menu item "DBA General" / "Oracle Parameter" allows to display the initialization parameters of the DB. Filtering the "Default" column to "FALSE" shows the explicitly set initialization parameters of the DB.
4.2. Evaluate the memory configuration of the DB system
Menu item "DBA/SGA details" / "SGA memory" / "SGA components" shows the memory usage of the SGA (Shared Global Area).
This allows conclusions to be drawn about the use of the physical main memory for the individual SGA components. The allocation of the memory to the components is usually done dynamically according to necessity, optionally controlled via init parameters. The optimization goal is usually to use as much of the physical memory as possible for the DB cache and InMemory area, but to limit the shared pool usage for the library cache incl. SQL area etc. to what is necessary. The list of objects in the library cache, grouped by type and namespace, allows a detailed listing of the concrete objects with the size of the allocated memory.
4.3. Evaluation of sufficient dimensioning of the redo log files
Menu item "DBA-General" / "Redologs" / "Current" shows the current configuration of the redo log files. Menu item "DBA General" / "Redologs" / "Historical" shows the past usage of the redo log files per AWR snapshot, including the number of log switches and the number of log files still active and not archived at the time of the snapshot.
The number of active or not yet archived log files should never reach the number of existing log file groups for production systems. If this does happen, there is a risk that the DB cannot complete a log switch that is due and all writing activities of the DB are stopped until the next log file is free for reuse. This risk is often latent, since DBs are created by default with only 3 logfile groups and this is often not adapted even for productive systems. With increased write load, a temporary freezing of write processes is preprogrammed for such DBs.
4.4. Evaluate the stress and performance of the I/O system
Menu "I/O analysis" contains several historic characteristics, throughput and time related values about usage and performance of the underlying I/O system.
4.5. DB audit trail
4.5.1. Audit configuration
Menu item "DBA General" / "Audit Trail" / "Auditing rules" shows the current configuration of the DB audit trail as well as several auditing rules.
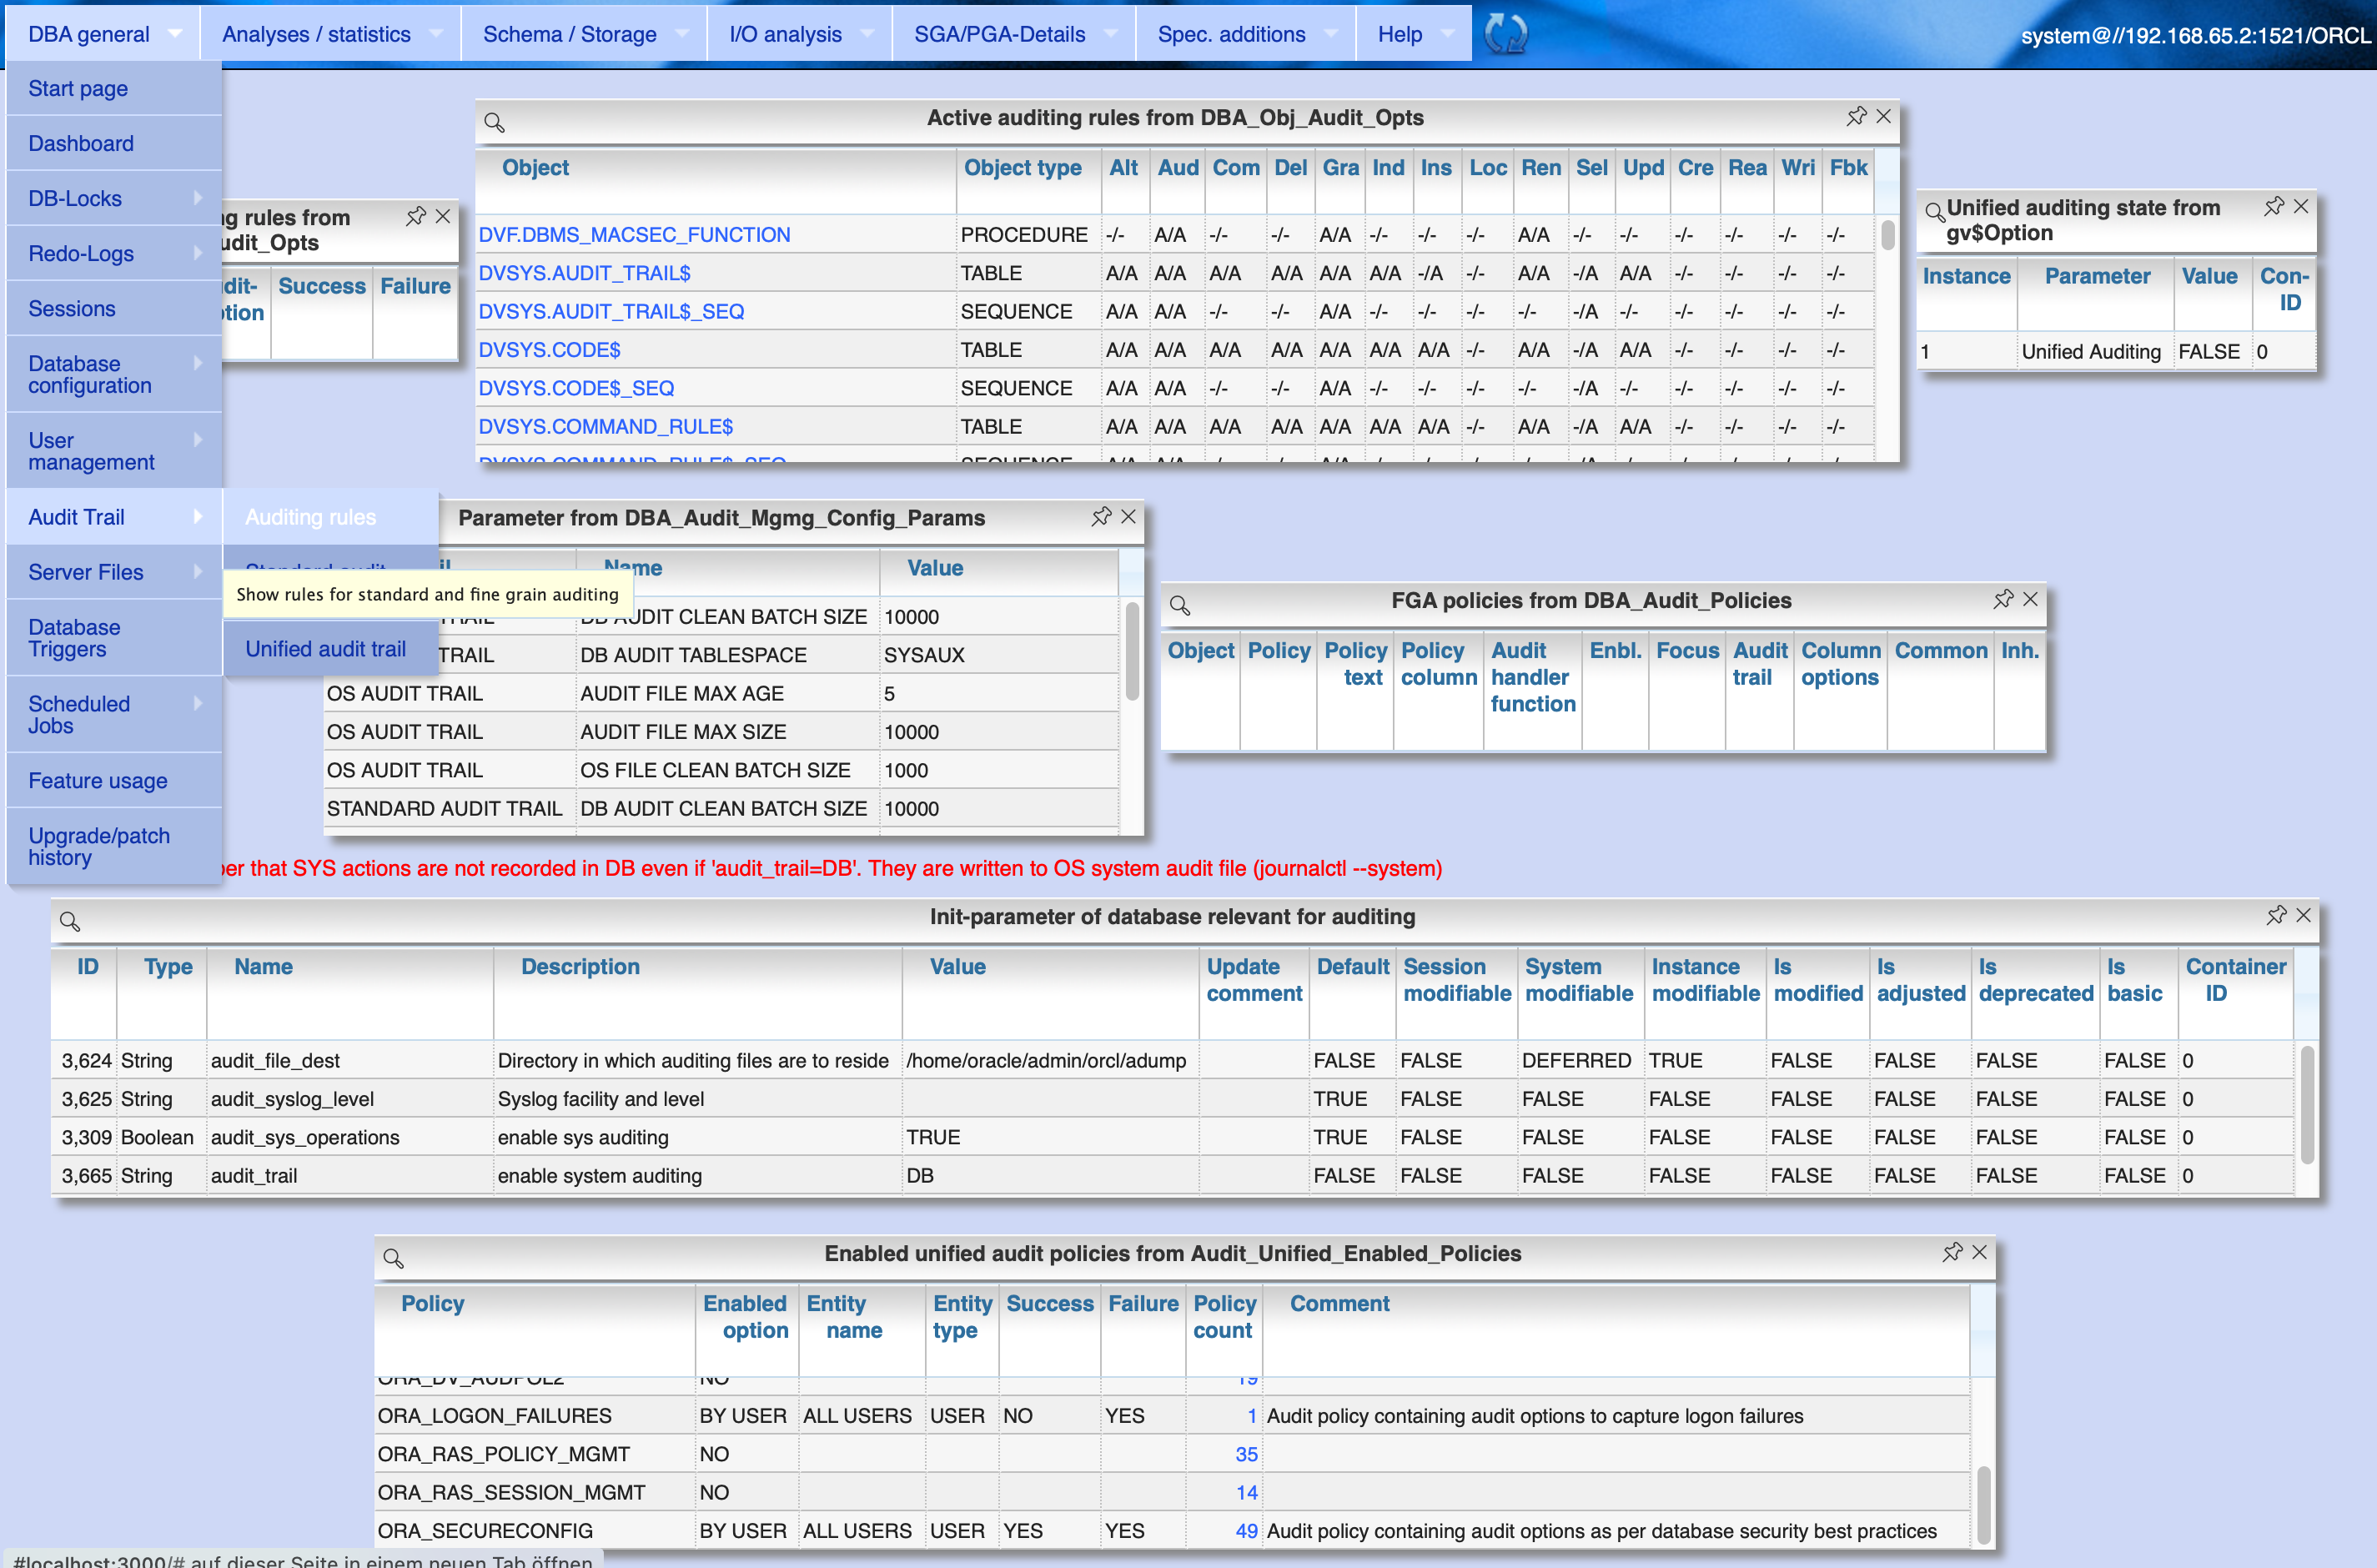
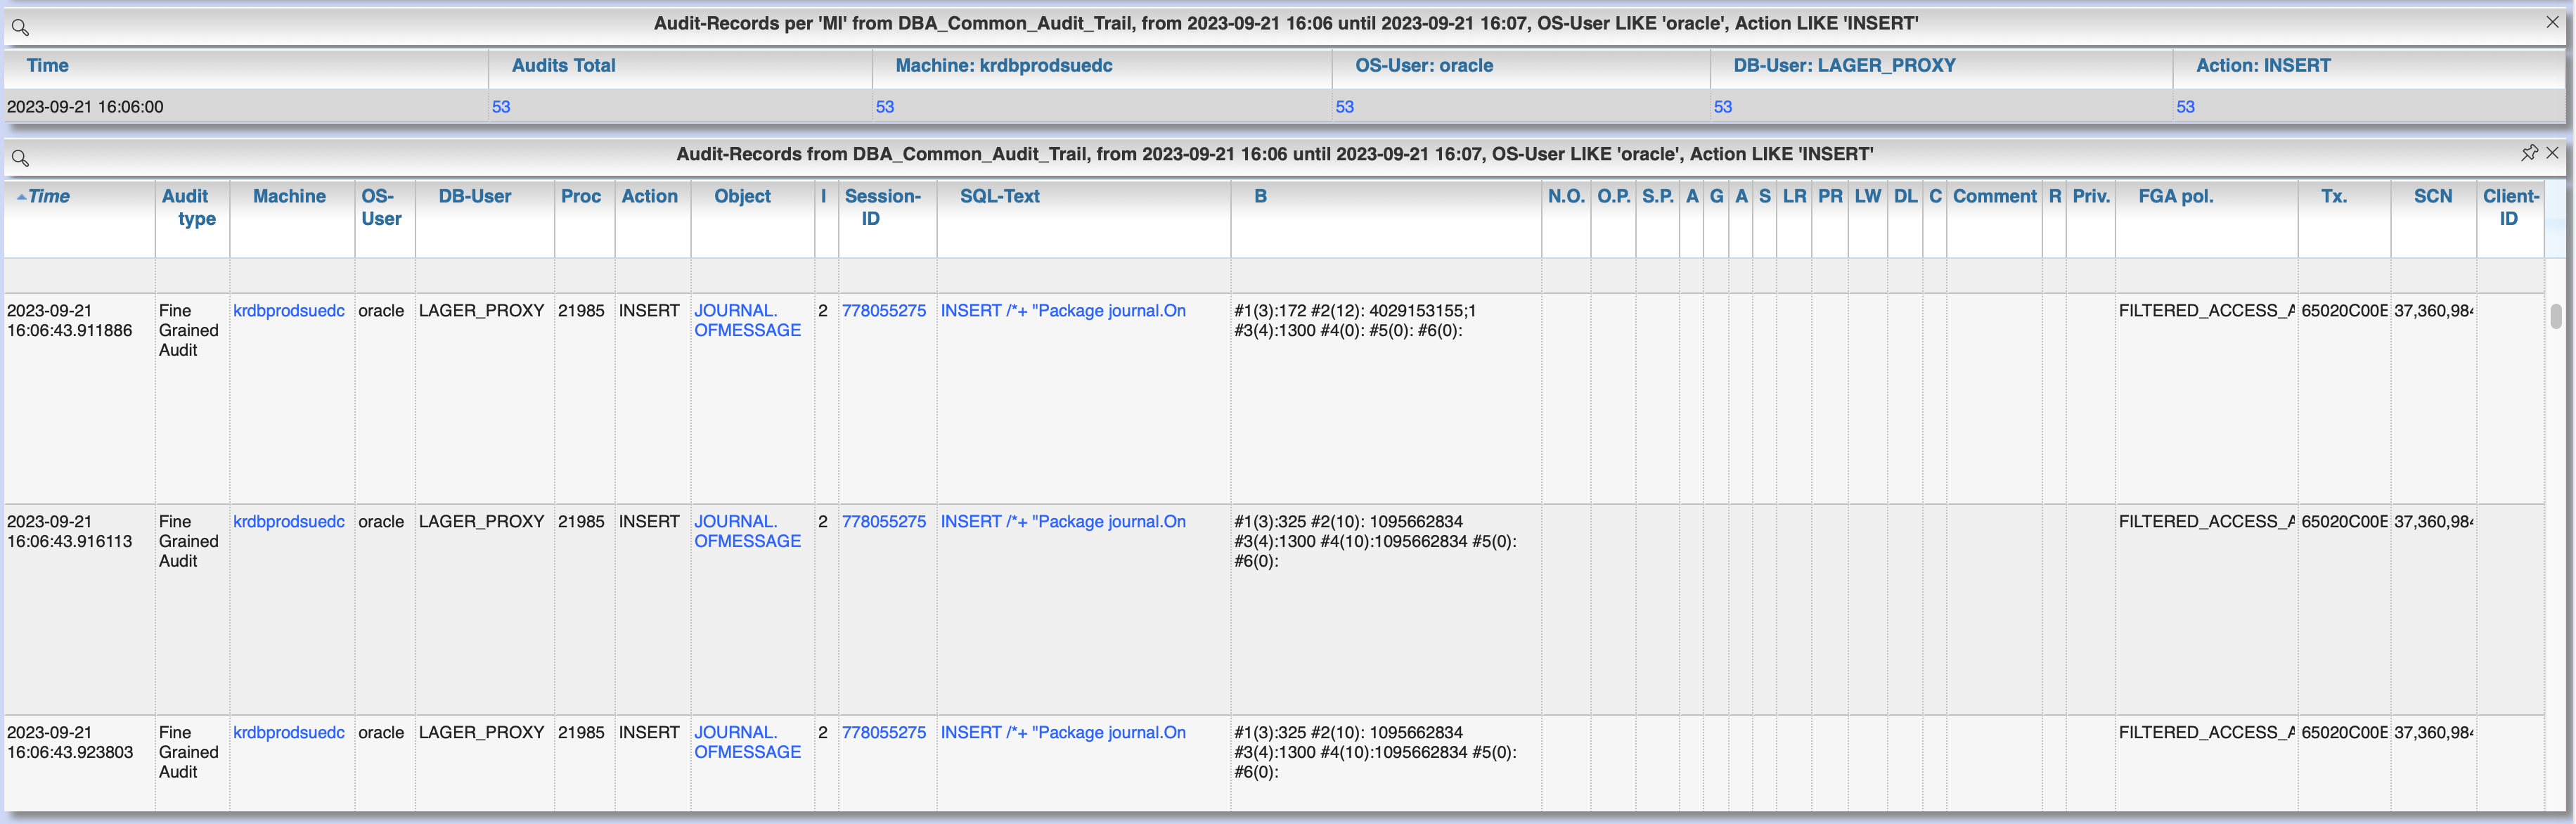
4.5.2. Standard audit trail
Menu item "DBA General" / "Audit Trail" / "Standard audit trail" opens a dialog for evaluation of standard audit trail including find grained audit trail. Depending on the choosen value for "Grouping" single audit records are show or the result is grouped by time with record counts for the top x actions, machines and users.
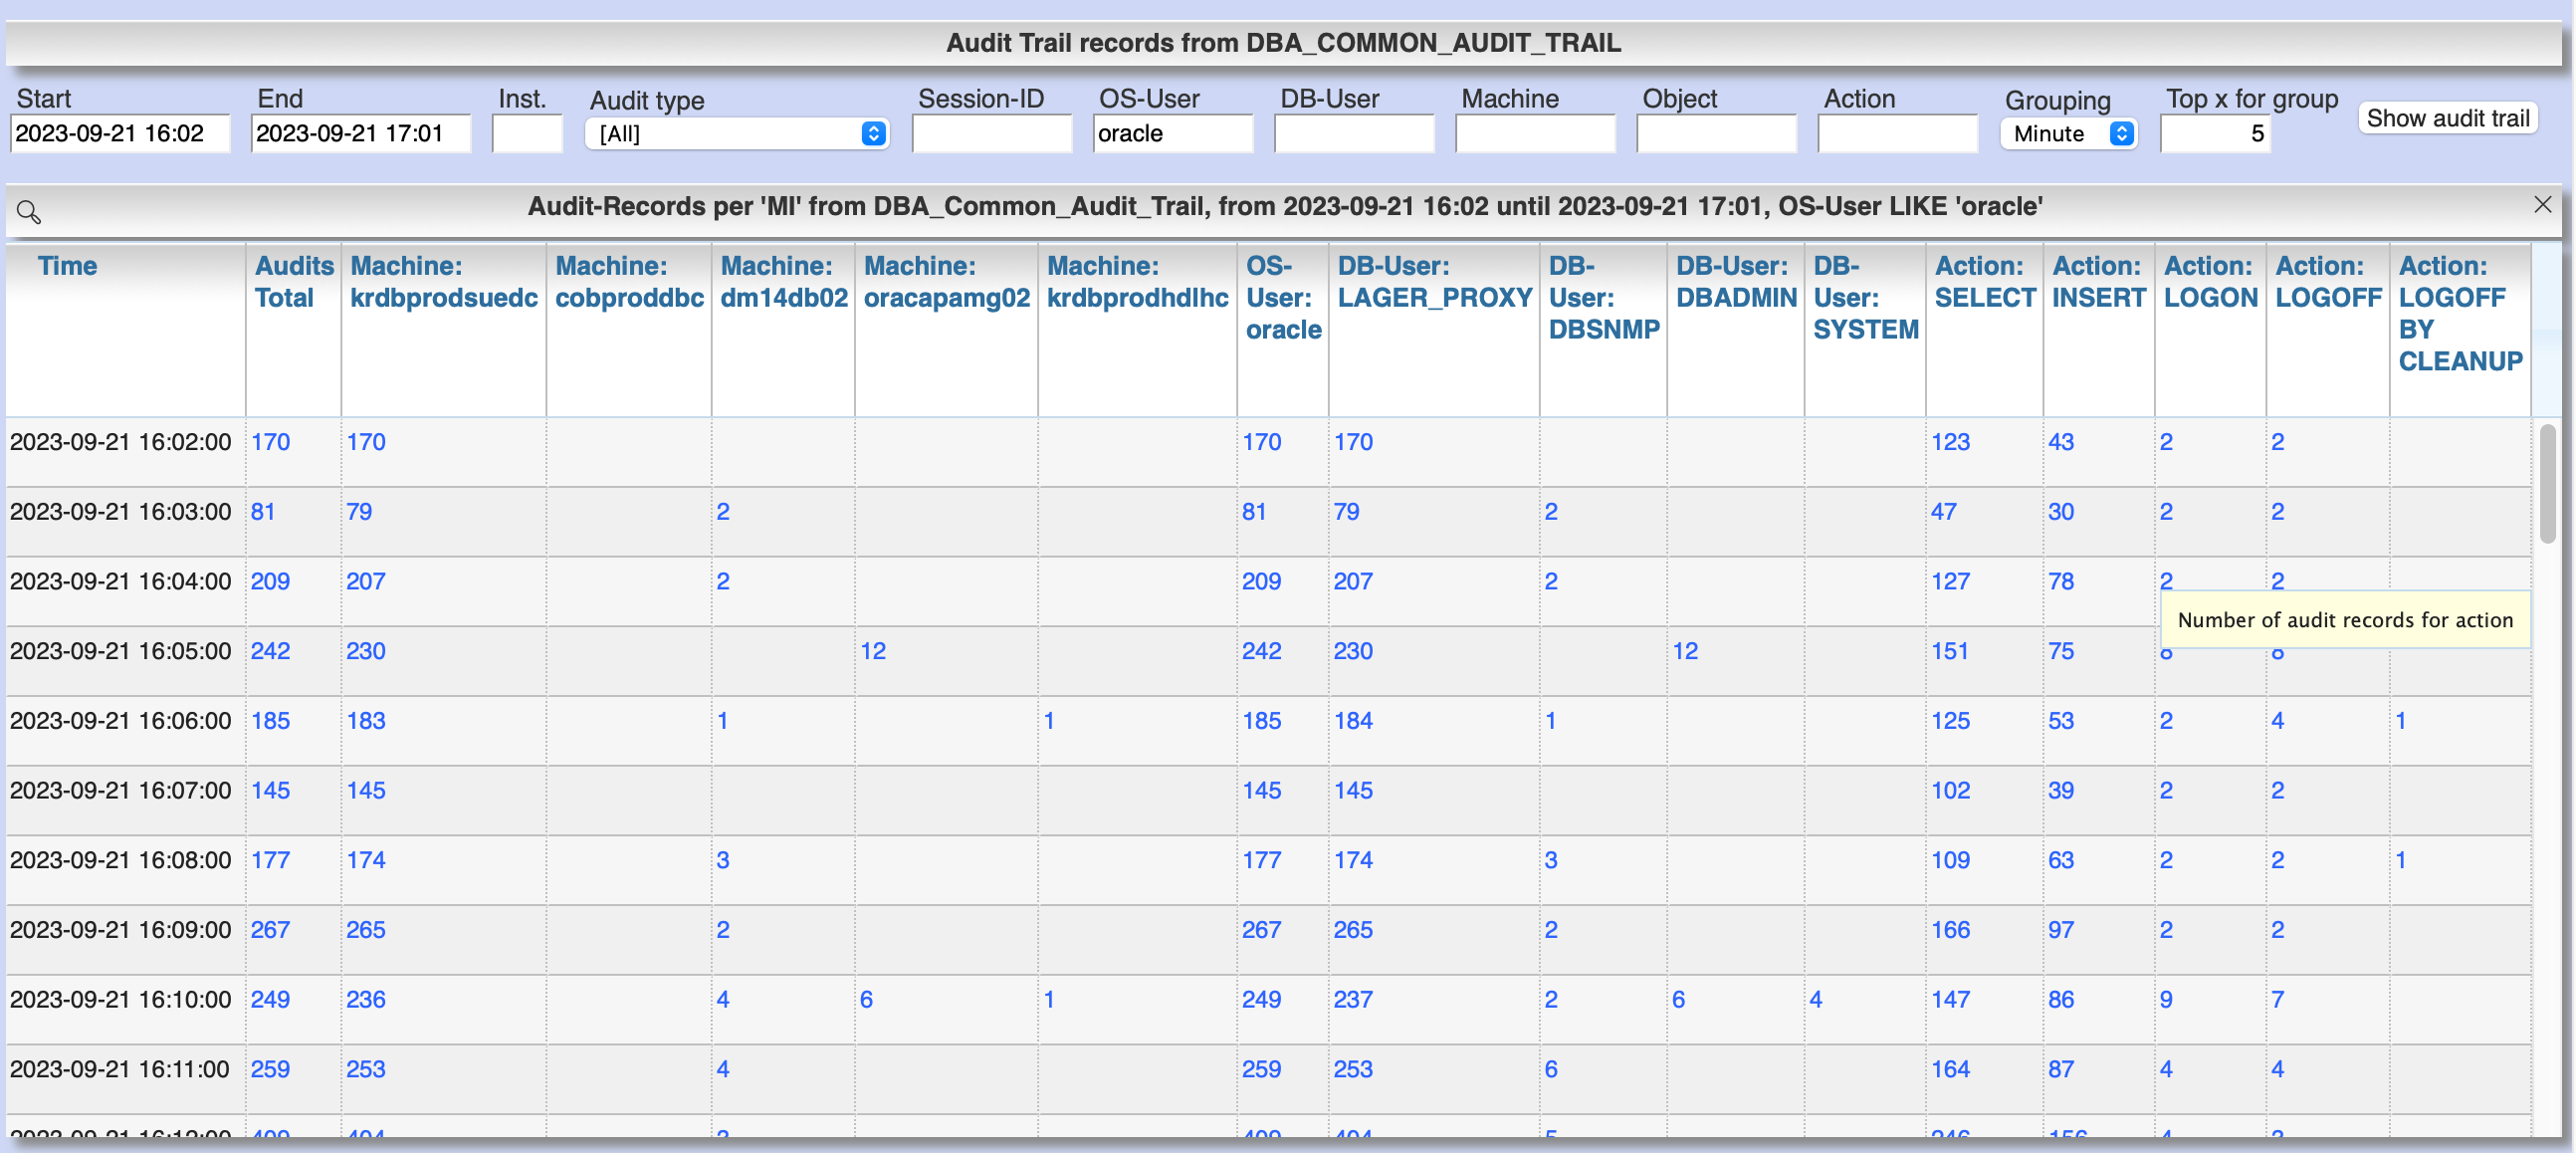
By clicking at the links in the columns for "Action", "Machine", "User" etc. you can refine the grouped result. Clicking at the column "Audits total" shows the single audit records for the selected grouping.
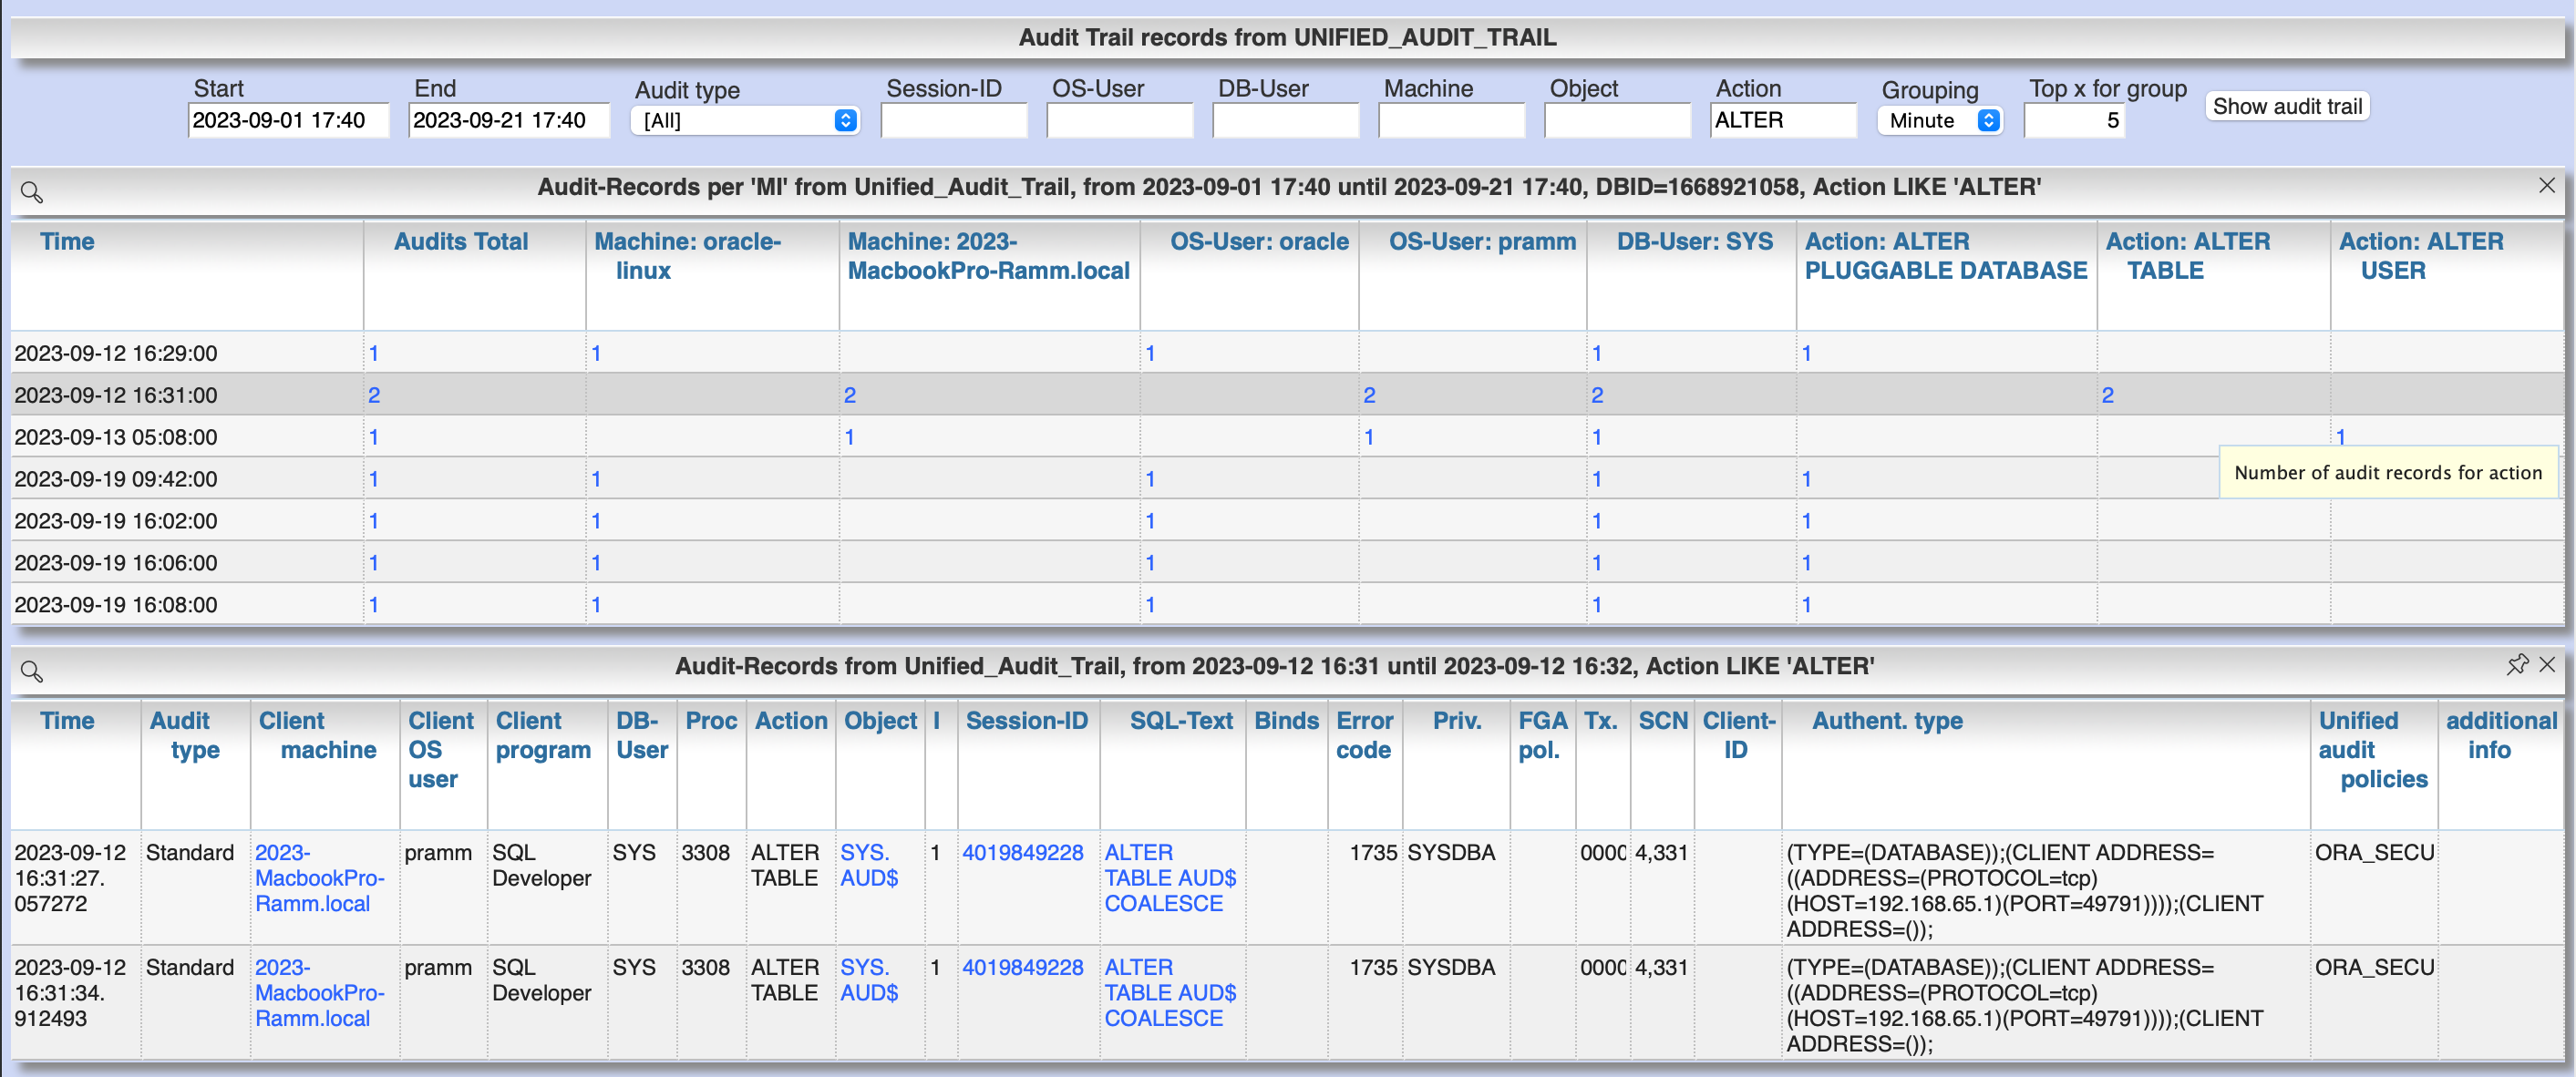
4.5.3. Unified audit trail
Menu item "DBA General" / "Audit Trail" / "Unified audit trail" works similar like the previous section for standard audit trail, but for the unified audit trail.
Filter and group the result and show detail records:
5. Application design requirements for optimal performance
5.1. Tag DB sessions via DBMS_Application_Info
The DB allows the tagging of DB sessions with context information about modules and action (64 characters each). This information on modules and action are recorded in various histories (including in ASH and SQL statistics) and allow the subsequent assignment of the various tracks in the DB to the subject context.
The information is set by calling:
DBMS_Application_Info.Set_Module(module, action);
It is advisable to anchor the placement of modules and action deep in the technical infrastructure of the application in order to obtain a complete tagging, e.g. to ensure at the beginning of transactions or request processing.
In particular, when using connection pools, with only sporadic setting of modules and action, there is the risk that subsequent activities on a reused session of the pool with respect to modules / action remain assigned to a random predecessor activity of this session.
5.2. Use of binding variables
TODO: Transfer content from german document
5.3. Efficient use of PL / SQL in SQL statements
TODO: Transfer content from german document
5.3.1. Pragma UDF for preventing context switches
5.3.2. Direct addressing of package constants instead of package functions
5.4. Efficient data structures
5.4.1. Indexing
TODO: Transfer content from german document
5.4.2. Securing references, uniqueness and rules
TODO: Transfer content from german document
5.5. Usage of views
TODO: Transfer content from german document
6. Influencing the execution plan of critical SQLs
6.1. Ensure up-to-date and realistic object analysis data
The first prerequisite for optimal execution plans is the existence of true-to-life object statistics! For this a regular analysis of tables and indices should be ensured by the default scheduler settings of the DB or independent analysis.
The detail view of DB objects (menu item "Schema/Storage" / "Describe Object" as well as various linksI) allows to determine current values of record numbers of objects.
For this purpose, the current number of rows of the object can be determined for tables and indices by clicking in the "Rows" column. The comparison with the number of rows according to the last analysis allows the assessment of the usefulness of the available analysis data.
In case of gross discrepancy between analysis and reality with problematic effects on the execution of SQLs, a new analysis via DBMS_STATS.GATHER_TABLE_STATS is recommended.
6.2. Act directly on the execution plan of SQLs without changing the application code
6.2.1. Fix execution plans to a concrete plan by SQL Plan Baseline
SQL plan baselines allow a concrete execution plan to be specified in a binding manner when a syntactically identical SQL statement is executed (SQL ID hash).
It is not the concrete execution plan that is specified here, but the plan hash value of the plan to be used. This means that the optimizer itself must be able to determine this plan with the plan hash value to be obtained.
Prerequisite for the use of SQL Plan Baselines is the Enterprise Edition of the Oracle DB.
6.2.1.1. Use of better past execution plans from AWR history per SQL plan baseline
SQL plan baselines allow a concrete execution plan to be specified in a binding manner when a syntactically identical SQL statement is executed (SQL ID hash).
If a better execution plan exists in the AWR history of an SQL, Panorama can generate a PL/SQL snippet to fix this plan via SQL plan baseline.
To do this, perform the following steps:
-
from SQL detail view (current or historical) via button "Complete history" select the period in which the SQL with better execution plan was active.
-
Select the SQL detail view for the selected time period by clicking the Start Time button
-
Click on button "SQL Plan Baseline" to generate the PL/SQL snippet for execution by SYSDBA
-
If more than one execution plan was active in the time period, a list for selecting the appropriate execution plan appears beforehand
Creating a SQL Plan Baseline this way requires licensing the Tuning Pack on this DB, because DBMS_SQLTUNE.CREATE_SQLSET is used to take the plan from AWR. The possible existence of a default by SQL plan baseline is shown in the detail view of the SQL in signal red.
6.2.1.2. Fix an execution plan from the current SGA as an SQL plan baseline
As an alternative to the AWR source, SQL plan baselines can also be generated from the current cursor cache of the SGA
6.2.2. Specification of optimizer hints via SQL Profiles
SQL profiles can be generated via the SQL tuning functions of the Oracle Enterprise Manager (or newly Cloud Control), which influence the execution plan for a concrete SQL statement by specifying optimizer hints.
The possible existence of a specification by SQL profiles is displayed in the detail view of the SQL in signal red.
6.2.3. Specification of optimizer hints via SQL Patch
SQL patches (available from Release 11.1) allow to specify alternative optimizer hints in a less complex way than via SQL profiles.
SQL patches can be used without additional license also in Standard Edition.
The possible existence of a default SQL patch is shown in the detail view of the SQL in signal red.
A PL/SQL snippet for creating an SQL patch for a concrete SQL statement can be generated using the "SQL patch" button of the SQL detail view (current or historical).
6.2.4. Dynamically changing the SQL text via SQL Translation
As of version 12.1, the SQL Translation Framework allows alternative SQL texts to be stored for an SQL statement.
Before the SQL is executed, the SQL text is replaced by the stored alternative SQL text.
This function allows total influence on the executed SQL.
Not only can Optimizer hints be added to the SQL, but result columns can be exchanged, JOIN relationships can be removed or added, selections can be made from other sources, etc. .
The condition is that the alternative SQL has the same result structure and supports the same binding variables as the original SQL.
The possible existence of an alternative SQL text is indicated in the detail view of the SQL in signal red.
A PL/SQL snippet for creating an SQL translation for a concrete SQL statement can be generated using the "SQL translation" button of the SQL detail view (current or historical).
7. Ensure optimal storage utilization
Optimization to minimize the use of storage and the physical size of DB objects addresses the following objectives:
-
Reduction of the storage resources used (costs, necessity of hardware expansions, possibly more applications accessible on existing hardware)
-
more effective use of the DB cache (higher cache hit rate, less load from individual objects)
-
Reduction of SQL execution times due to less I/O effort as well as higher hit rate in the DB cache
-
Higher protection against the risk of unplanned size growth through more free/available tablespace
7.1. Get information about storage usage
7.1.1. Overview over current storage usage
7.1.2. Evolution of storage usage over time
7.1.3. Deleted objects in the Recycle Bin
Menu item "Schema /Storage" / "Recycle bin" shows the current occupancy of the recycle bin of the DB. Selection by size and drop time allows prompt release of relevant storage sizes of deleted objects after sufficient grace period.
7.2. Release unused space below the high-water mark / offcut
7.3. Compression of tables
7.3.1. Partitioning to separate current and legacy data
Use interval partitioning to automate the partitioning process
7.4. Compression of indexes
7.5. Use function based indexes to reduce indexes to values of interest
Often, indexes are built over all records in a table, even though the index is accessed with only one or a few values that comprise only a very small portion of the total set of records.
Example:
A table TAB with 400 million records contains a column Status with the values 'N' for new and 'P' for processed.
For processing, all new records with status = 'N' are selected and updated to status 'P' in the processing transaction.
In order to be able to select all approx. 300 new records for processing sufficiently quickly, there is an index on the Status column with a two-digit gigabyte size.
For an access with status = 'P' this index is never used.
If it were, this access via index would take dramatically longer than a FullTableScan (which the optimizer clearly recognizes on the basis of the histogram data, if the parameter 'P' is known to it).
Selection is done as follows:
SELECT * FROM Tab WHERE Status = 'N';
Alternative solution:
By using a function-based index that indexes the value 'N' of the column, the size of the index in the example can be reduced from two-digit gigabytes by a factor of 1,000,000 to a few kilobytes, since NULL values are not stored in the index.
CREATE INDEX Ix_Tab ON TAB(DECODE(Status, 'N', 'N', NULL);
To use the function-based index, the SQL must use the syntactically identical expression in the WHERE clause
SELECT * FROM Tab WHERE DECODE(Status, 'N', 'N', NULL) = 'N';
Extended example:
Since now only the existence of a record in the index is sufficient for access, the index value itself can contain an additional access criterion. For a two-column index consisting of Status and ArtNr and an access per
SELECT * FROM Tab WHERE Status = 'N' AND ArtNr = :artnr;
a single-column and dramatically smaller index would be established instead
CREATE INDEX Ix_Tab ON TAB(DECODE(Status, 'N', ArtNr, NULL);
and an access with effect of both filters on Status='N' and ArtNr per
SELECT * FROM Tab WHERE DECODE(Status, 'N', ArtNr, NULL) = :artnr;
7.6. Determination of unused tables
Unused (and with corresponding probability dispensable) tables are those on which there are no accesses at all over a longer period of time as well as those tables in which only writing takes place, but whose contents are never used.
7.7. Identification and removal of unused indexes
7.7.1. Establishment of monitoring usage for the detection of unused indices
Detailed steps for establishing and using Monitoring Usage are described here.